"Statistics hide more than what they reveal", I could related to the meaning of this quote after coming across a post election results number crunching done by an analyst.
It all started with this analysis of facebook. This analysis goes on to say that if BJP and KJP had stayed together, their combined votes would have been greater than that of the Congress in 93 constituencies. What this analyst omits is whether BJP+KJP would have won in all these 93 seats? Definitely not, because there might be other parties who could have garnered more votes that BJP+KJP or Congress. Though the analyst doesn't mention that BJP would have won in 93 seats, it kind of leads the end user to believe so. I am not blaming the analyst here, but sharing my opinion of what it made me think.
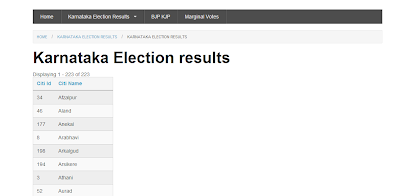
So out of curiosity I just wanted to see in how many places BJP+KJP votes would have been greater than the winning votes. So I set out find out the data of the Karnataka Election results. I was not able to find any open data that was in a consumable format for a developer[Kindly let me know if there is one. I thought it was better to hack into their site than file for an RTI]. All I had was this http://eciresults.nic.in/ConstituencywiseS10171.htm . An ill designed website(Can you still imagine that they use tables within tables :P) that would let me check the results only by the constituencies and not any other parameter. So if I need to get the complete data I need to visit 223 such pages that gives me results for their respective constituencies. So I looked at the URL naming patterns and it turned out that there was a co-relation between the results url and the constituency code. So I took a list of all the constituency codes from the drop-down on the page, used some notepad++ macros to clean up the HTML mess and make it a php array. Once I had the array of constituency codes I wrote a simple script to scrape the 223 urls and get the relevant data. Then I imported this data into my database using a CSV file. I wrote a few views handlers to expose the database table to views on my drupal site. Created three views to display the data.


* I was able to complete all of these in a span of 3 days. Special thanks to www.devthon.org which give me the ideal ambiance to work on this project. Thanks to my company www.azrisolutions.com for sponsoring the devthon event and supporting me.
It all started with this analysis of facebook. This analysis goes on to say that if BJP and KJP had stayed together, their combined votes would have been greater than that of the Congress in 93 constituencies. What this analyst omits is whether BJP+KJP would have won in all these 93 seats? Definitely not, because there might be other parties who could have garnered more votes that BJP+KJP or Congress. Though the analyst doesn't mention that BJP would have won in 93 seats, it kind of leads the end user to believe so. I am not blaming the analyst here, but sharing my opinion of what it made me think.
So out of curiosity I just wanted to see in how many places BJP+KJP votes would have been greater than the winning votes. So I set out find out the data of the Karnataka Election results. I was not able to find any open data that was in a consumable format for a developer[Kindly let me know if there is one. I thought it was better to hack into their site than file for an RTI]. All I had was this http://eciresults.nic.in/ConstituencywiseS10171.htm . An ill designed website(Can you still imagine that they use tables within tables :P) that would let me check the results only by the constituencies and not any other parameter. So if I need to get the complete data I need to visit 223 such pages that gives me results for their respective constituencies. So I looked at the URL naming patterns and it turned out that there was a co-relation between the results url and the constituency code. So I took a list of all the constituency codes from the drop-down on the page, used some notepad++ macros to clean up the HTML mess and make it a php array. Once I had the array of constituency codes I wrote a simple script to scrape the 223 urls and get the relevant data. Then I imported this data into my database using a CSV file. I wrote a few views handlers to expose the database table to views on my drupal site. Created three views to display the data.


I also made the output available in a json format so that other developers can use the data to form their own visualizations.
The end points are
- Votes recieved : http://diasporaindica.com/rest/ker.json
- Constituencies : http://diasporaindica.com/rest/parties.json
- Cities : http://diasporaindica.com/rest/cities.json
Using these data I was able to validate the following two theories.
- BJP + KJP : BJP along with KJP could have won only in 75 constituencies, thought there combined votes would have been more than Congress in 93 locations. http://diasporaindica.com/karnic_bjp_kjp
- Marginal Votes : Since the Indian electoral system follows winner takes it all approach, marginal votes play an important role deciding the outcome. Infact it is because of these marginal votes that the corrupt politicians are ready to pay huge premiums of money and liquour for every single vote. And Independent parties though they may not have a huge share of votes, they can play the spoil sport by ruining some big shots chances. So I did a simple calculation to see in how many places the sum of all votes received by all the independents was greater than the difference between the top two candidates. Surprisingly it turns out that they could have played a crucial role in 47 constituencies.
- That made me curious about the Independent parties. So I dug in a little more deep using the screens I had created. And I found out that there are 1217 Independent candidates who participated in these elections. http://diasporaindica.com/karnataka-election-results?candidate_name=&citi_name=&party_name=Independent&items_per_page=All&offset=0&order=votes_recieved&sort=asc with the least number of votes being 52 votes :P
The following are some of the visulization I built using this data.
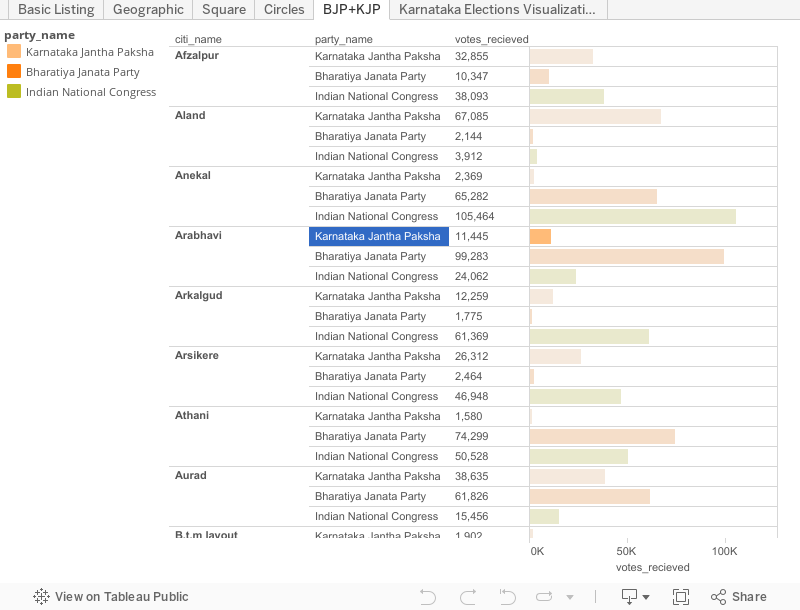
In the first visualization I have ordered Congress first, BJP + KJP next. I have kept their colours similar so that you get a sense of how they could have performed togehter and then followed by JDU and independents.
With this basic Proof of Concept of how the data can be made publicly accessible using the APIs and how the data can be used to make various analysis and visulizations of the results I hope the Gov will consider making the next election results open data.